# estimating time using temperature
In the previous post / blog, we estimated how much radiation the earth gets from the sun, now to exploit that idea to estimate time of the day based on the temperature which is directly affected by the solar radiation among other things.
First, we should note that we are aiming here to calculate time of the day, based on the solar day, which is different than the time of the day based on the local timezone, the latter is a discretized approximation of the former, and is based not just by the sun, but also politics, religious activities that shift the biological day of the population, economic blocks that prefer to be synchronized, etc...
Second, you may notice that we measure solar radiation through temperature, which are not the same, the only actual major difference is the temporal shift due to thermal inertia, meaning the earth needs some time to catch heat, and similarly to dispose of it, it also may vary depending on the region, other factors like clouds and winds are within the margin of error.
To accommodate for the thermal inertia and the difference between solar clock and the local timezone, the user should input a correction term which we call 'lag' corresponding to the time on which the temperature is at its maximum, that's the solar noon, a lag of 0 implies that the hottest time of the day is at 12h00.
We fetch some real world weather temperature from a weather API, I use open meteo, here a command to fetch Casablanca's previous day temperature data as a JSON:
curl "https://api.open-meteo.com/v1/forecast?latitude=33.5883&longitude=-7.6114&minutely_15=temperature_2m&timezone=Europe%2FLondon&past_days=1&forecast_days=0"the data comes as a neat python formatted array, so I wouldn't be bothered by using the official library, a simple copy paste into a file is sufficient, there should be a command to do that more efficiently using piping, but again it's a one time thing.
Now a correlation function sweeping over our signal (or record) against the theoretical sample to determine which is the most probable to be the one represented in the sample, the parameters here are such 'r' is the real world data, 't' is the theoretical analysis data.
def correlate(r, t):
    out = []
    for start in range(len(t)):
        out += [sum(r[i] * t[(start + i) % len(t)] for i in range(len(r)))]
    return out
the data should first be normalised.
def norm(x):
    n = len(x)
    mean = sum(x) / n
    var = sum((v - mean) ** 2 for v in x) / n
    std = var ** (1/2)
    return [(v - mean) / std for v in x]
the lag and the latitude are specified by the user to fit local clock. I emulated incremental recording of a sensor as it adds samples as it runs, by chopping the real data and measuring the error and the confidence afterward.
the lag is measured by taking the difference between local 12h00 and the time when the temperature is at maximum in hours - the difference - and multiplying it by 4 as the open-meteo provides samples measured every 15 minutes. the standard latitude should be subtracted from 90 as in the code the 90 deg north pole corresponds to latitude of 0 deg.
lat = 90 - 34
lag = 17
error = []
confidence = []

for i in range(2, len(rtemp)):
    corr = correlate(norm(rtemp[:i]), norm(ttemp[lat]))
    nowisthetime = max(range(len(corr)), key=lambda k: corr[k])
    last_sample_index = nowisthetime + len(a) - 1
    error += [(last_sample_index-i+lag)%96]
    confidence += [corr[nowisthetime]]
and of course a vibe coded function to nicely print timestamps as a clock:
def time_str(n):
    h, m = divmod(15*n, 60)
    return f"{h%24:02d}:{m:02d}"
here are the results:
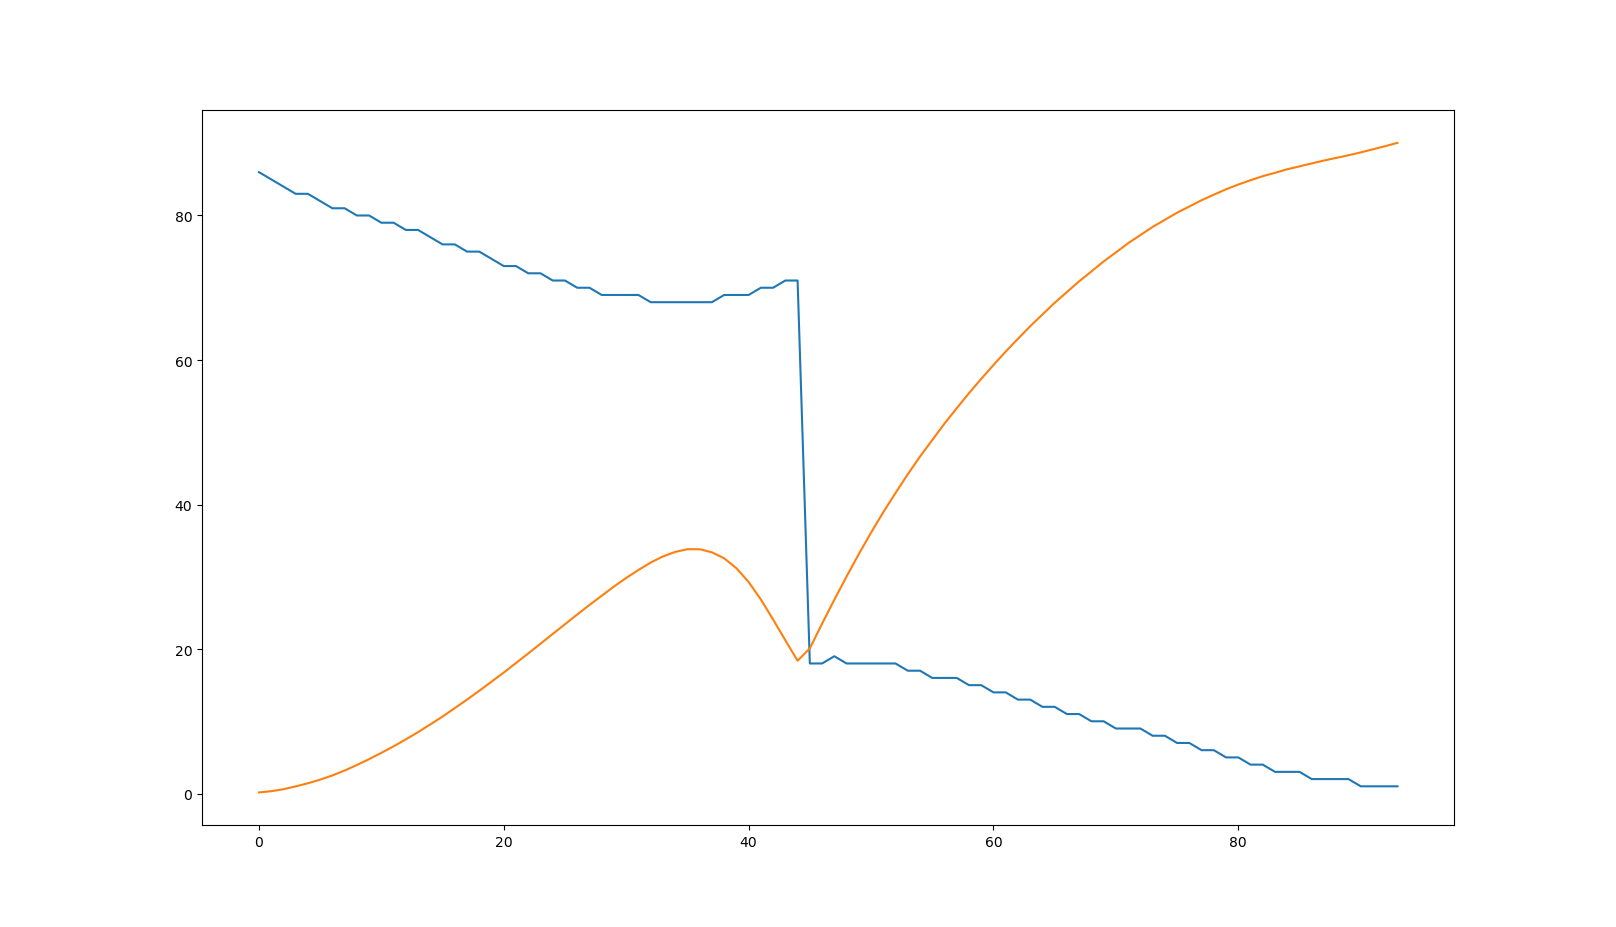
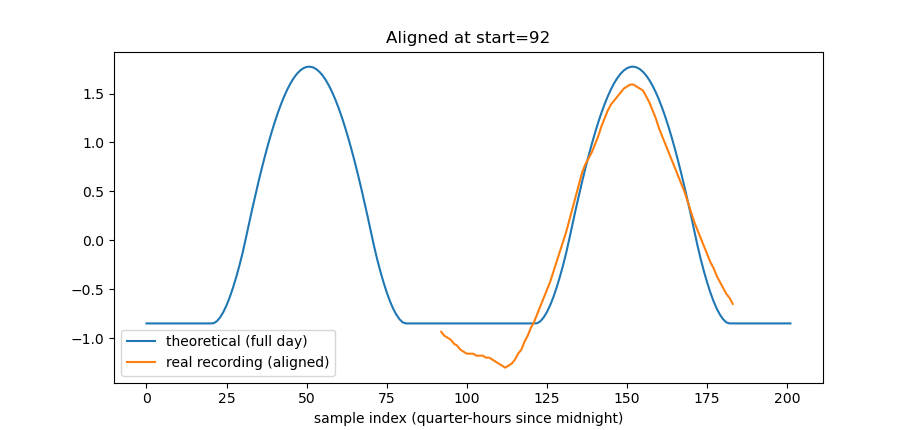
overlay the real world data as shifted by the resulted beginning time:
error in blue (how much 15 min samples)
and confidence (in percent) (just the result of the correlation function)